In November, Andrew Stevens and Angele Poirier released a report that examined the union effect on wages and benefits across Canada to 2022, with the data for Saskatchewan also broken out.
Nationally, unionized workers earned an average of 11% more than non-unionized workers. There was significant provincial, gender, age, and sectoral variation. The union advantage appeared particularly pronounced for workers aged 15 to 24 (+26%) and part-time workers (+41%).
Unionized workers were also more likely to have paid sick time (80% versus 555 for nonunionized). Unionized workers were also much more likely to have employment-related pension plans (825 versus 37%) as well as other supplementary benefits.
Interestingly, non-unionized workers experienced slightly higher wage increases between 2020 and 2022. This might reflect pressure on non-union employers to improve wages in order to attract and retain staff (i.e., is a union spill-over effect). It might also reflect that union contracts (which fix compensation for a period of time) may delay increases (e.g., inflationary bumps) or unionized workers (who are very often in the public sector) may have been subject to mandated wage freezes and rollbacks by the state.
-- Bob Barnetson
Showing posts with label statistics. Show all posts
Showing posts with label statistics. Show all posts
Friday, January 12, 2024

Wednesday, October 18, 2023
Alberta Labour 2023 Annual Report
Alberta has released its 2023 annual report for the part of the government that was at one time called Labour and that relate to Albertans being safe and treated fairly in the workplace.
Fairness at Work Declines
The number of employment standards complaints filed were up by about a third in 2022/23. Complaints tend to reflect a fraction of overall violations; most workers don’t bother reporting things like wage theft.
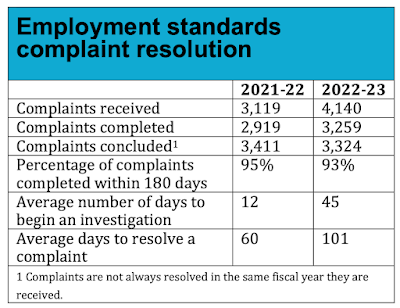
This is an interesting reversal of a long-term decline in employment standards complaints.

Notably, the time to begin an investigation tripled and the time to resolve a complaint doubled. This has long been a bugbear in the employment standards system. The report asserts this reflects increasing volume and complexity.
The number of complaints investigated with signs of human trafficking jumped from 102 in 2021/22 to 208 in 20223/23.
The number of administrative penalties issued to employers dropped from 3 in 2021/22 to zero in 2022/23.
Safety: Losing the Will to Enforce
Worksite inspections plus re-inspections totalled 13,717 in 2023/23, down 12% from 15,569 in 2021/22. If you look later in the report for some context, this is about 6% fewer inspections/re-inspections than in 2018/19 (14,590), which was the last full year when the NDs were in power. At this rate, the inspection cycle is theoretically about once every 15 years (give or take).
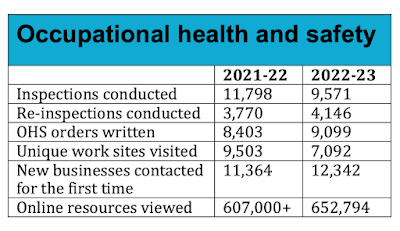
About 80% of inspections were the results of complaints while the remaining 20% were targeting industries with safety problems. There were 1207 proactive inspections in 2022/23 resulting in 1725 orders issued. This is down from 2021/22, with 2100 inspections and 2548 orders. I couldn't find any historical data in this to provide context.
The number of investigations (e.g., of injuries) dropped by 60%, from 2245 in 2018/19 to 888 in 2022/23.
Orders written were up slightly over 2021/22 to 9099. This may be good (more enforcement) or may be bad (more violations occuring)—hard to say. If you look at 2018/19, there were 16,680 orders issued.
Ticketing of violators was down. There were 27 tickets with a total value of $11,280 issued in 2022/23. This is slightly fewer than in 2021/22 (32 tickets, $11,500). This reporting leaves out important context. If you look at 2018/19, there were 479 tickets issued.
Administrative penalties were also down. There were 17 penalties worth $62,025 issued in 2022/23. This is notably fewer than in 2021/22 (37, $314,250).
Convictions were also down, with 2022/23 seeing $1,740,750 in fines assessed. This is down from $1,919,000 in 2021/22. There was no reporting of the number of convictions but a hand count suggests the number is stable the last few years at around (hand-waggle) 10 per year, down from more than 20 in 2018/19.
Injury Rates are Up: Yeah, it’s mostly COVID.
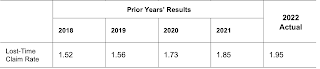
The lost-time claim rate rose for at least the seventh straight year. Much, but not all, of this increase is due to COVID-19 injuries.
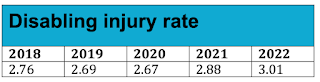
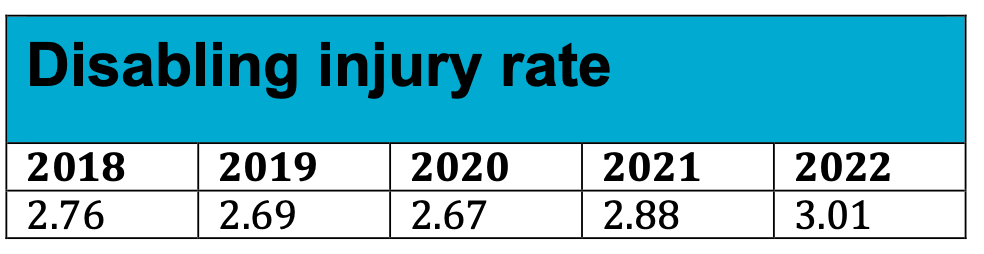
The disabling injury rate (lost-time plus modified work) is also up. Again, much but not all of the increase is due to COVID injuries.
The absence of meaningful government protocols related to aerosol spread put responsibility for these COVID-related increases squarely on the shoulders of government.
Interestingly, the absolute number of accepted fatalities is down to 120 (from 136). There is no real analysis of that change. It could be the result of changes in the workforce composition. It could also just be random variation (small numbers tends to be swingy).
Analysis
Overall, it looks like the government continues to lose the will and/or capacity to meaningfully enforce workplace safety rules under the UCP. Not surprisingly, the rate of injury has risen, likely because workplaces are more dangerous.
There has also been an uptick in complaints about employment standards (basically wage theft). This could be caused by more workers knowing to and being willing to come forward. I’d guess, though, that this reflects employers knowing it is open-season on workers under the UCP and, thus, stealing wages more frequently.
-- Bob Barnetson
Fairness at Work Declines
The number of employment standards complaints filed were up by about a third in 2022/23. Complaints tend to reflect a fraction of overall violations; most workers don’t bother reporting things like wage theft.

This is an interesting reversal of a long-term decline in employment standards complaints.

Notably, the time to begin an investigation tripled and the time to resolve a complaint doubled. This has long been a bugbear in the employment standards system. The report asserts this reflects increasing volume and complexity.
The number of complaints investigated with signs of human trafficking jumped from 102 in 2021/22 to 208 in 20223/23.
The number of administrative penalties issued to employers dropped from 3 in 2021/22 to zero in 2022/23.
Safety: Losing the Will to Enforce
Worksite inspections plus re-inspections totalled 13,717 in 2023/23, down 12% from 15,569 in 2021/22. If you look later in the report for some context, this is about 6% fewer inspections/re-inspections than in 2018/19 (14,590), which was the last full year when the NDs were in power. At this rate, the inspection cycle is theoretically about once every 15 years (give or take).

About 80% of inspections were the results of complaints while the remaining 20% were targeting industries with safety problems. There were 1207 proactive inspections in 2022/23 resulting in 1725 orders issued. This is down from 2021/22, with 2100 inspections and 2548 orders. I couldn't find any historical data in this to provide context.
The number of investigations (e.g., of injuries) dropped by 60%, from 2245 in 2018/19 to 888 in 2022/23.
Orders written were up slightly over 2021/22 to 9099. This may be good (more enforcement) or may be bad (more violations occuring)—hard to say. If you look at 2018/19, there were 16,680 orders issued.
Ticketing of violators was down. There were 27 tickets with a total value of $11,280 issued in 2022/23. This is slightly fewer than in 2021/22 (32 tickets, $11,500). This reporting leaves out important context. If you look at 2018/19, there were 479 tickets issued.
Administrative penalties were also down. There were 17 penalties worth $62,025 issued in 2022/23. This is notably fewer than in 2021/22 (37, $314,250).
Convictions were also down, with 2022/23 seeing $1,740,750 in fines assessed. This is down from $1,919,000 in 2021/22. There was no reporting of the number of convictions but a hand count suggests the number is stable the last few years at around (hand-waggle) 10 per year, down from more than 20 in 2018/19.
Injury Rates are Up: Yeah, it’s mostly COVID.
The lost-time claim rate rose for at least the seventh straight year. Much, but not all, of this increase is due to COVID-19 injuries.

The disabling injury rate (lost-time plus modified work) is also up. Again, much but not all of the increase is due to COVID injuries.
The absence of meaningful government protocols related to aerosol spread put responsibility for these COVID-related increases squarely on the shoulders of government.
Interestingly, the absolute number of accepted fatalities is down to 120 (from 136). There is no real analysis of that change. It could be the result of changes in the workforce composition. It could also just be random variation (small numbers tends to be swingy).
Analysis
Overall, it looks like the government continues to lose the will and/or capacity to meaningfully enforce workplace safety rules under the UCP. Not surprisingly, the rate of injury has risen, likely because workplaces are more dangerous.
There has also been an uptick in complaints about employment standards (basically wage theft). This could be caused by more workers knowing to and being willing to come forward. I’d guess, though, that this reflects employers knowing it is open-season on workers under the UCP and, thus, stealing wages more frequently.
-- Bob Barnetson
Thursday, June 1, 2023
Alberta's 2021 Injury and Fatality Report
Alberta released some injury-related reports in April. Here are the highlights from the 2021 Workplace Injury, Illness and Fatality Statistics report:
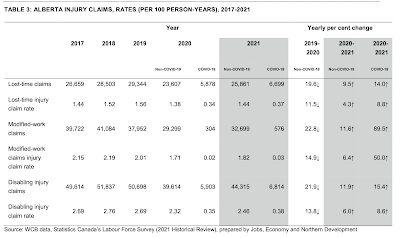
Table 3 (reproduced below) shows a pretty good summary. There was a significant drop in non-COVID injuries in 2020, which likely reflects the drop in employment during COVID (plus the crash in oil prices).
It is not clear to me what effect changes in the WCB legislation had on these numbers (I’d need to think a bit more about when the effect of those changes would start to show up).
- A 12% increase in accepted injury claims (exclusive of COVID claims).
- Youth (15-24) continue to have the highest adjusted disabling claim rate (but the lowest fatality rate (likely influenced by the importance in long-latency occupational diseases to overall fatality rates).
- There were 135 fatalities accepted by the WCB, including 25 from COVID.
Table 3 (reproduced below) shows a pretty good summary. There was a significant drop in non-COVID injuries in 2020, which likely reflects the drop in employment during COVID (plus the crash in oil prices).

It is not clear to me what effect changes in the WCB legislation had on these numbers (I’d need to think a bit more about when the effect of those changes would start to show up).
Controlling for the size of the workforce (the rate per 100 person years worked) we see a drop in the rate of injury. As employment numbers and oil prices bounce back up in 2021, we see numbers and rates start to increase.
-- Bob Barnetson
Thursday, March 16, 2023
Athabasca U staff engagement results are predictably terrible
This morning, Athabasca University released some of the results from its Autumn 2022 staff survey. The survey was about staff engagement, engagement means how willing staff are to put in discretionary effort to benefit the organization. AU framing its interest in workers as entirely instrumental was unexpected honest and went over poorly.
The basic talking points of the presenters were

Overall, about half of staff appear engaged. The biggest thing to note are the ~20% drop in that numbers since 2020. There was no explanation offered for this change but key events during that time include COVID (massive workload increases), forced relocation to home offices, efforts to bust the faculty association and deprive people of pensions, terrible wage settlements after a near strike, and using staff as hostages in a fight with the government. Given this, it is not surprising that many staff are just throwing up their hands and checking out.

In terms of organizational culture, these are some worrying results about caring, safety, and consultation. Again, it’s the leadership of the organization that primarily controls these aspects of the organization. The idea that staff can change the culture through some sort of personal-responsibility magic is just gaslight.

The innovation results are also quite negative. Again, look at the drops over time. I would say this manifests itself organizational in a sense that people are just giving up trying to solve problems and improve processes because it is just hopeless. Instead, some people are giving up and others are working themselves sick trying to protect students from the impact (which is not a sustainable option).

The basic talking points of the presenters were
- The data is four months old (i.e., things may not be as bad as the results suggest!).
- There is high trust among co-workers.
- All staff need to work hard and take responsibility for reversing these poor results.

Overall, about half of staff appear engaged. The biggest thing to note are the ~20% drop in that numbers since 2020. There was no explanation offered for this change but key events during that time include COVID (massive workload increases), forced relocation to home offices, efforts to bust the faculty association and deprive people of pensions, terrible wage settlements after a near strike, and using staff as hostages in a fight with the government. Given this, it is not surprising that many staff are just throwing up their hands and checking out.

Scores were broken out by different dimensions of engagement. Basically, people have good feelings about their coworkers and immediate managers. They have bad feelings about the senior leadership and how well the organization lives its values, focuses on learners, and innovates. Again, the drops really tell the tale of the deterioration since 2020.

Only about half of staff believe the institution lives its i-CARE values. There have been 11- to 18-point drops since 2020. Honestly, I’m surprised the drops have not been larger.


Only about half of staff believe the institution lives its i-CARE values. There have been 11- to 18-point drops since 2020. Honestly, I’m surprised the drops have not been larger.

These results show pretty clearly that the staff see the gaps between values and actions as occurring primarily at the leadership levels.


In terms of organizational culture, these are some worrying results about caring, safety, and consultation. Again, it’s the leadership of the organization that primarily controls these aspects of the organization. The idea that staff can change the culture through some sort of personal-responsibility magic is just gaslight.

The innovation results are also quite negative. Again, look at the drops over time. I would say this manifests itself organizational in a sense that people are just giving up trying to solve problems and improve processes because it is just hopeless. Instead, some people are giving up and others are working themselves sick trying to protect students from the impact (which is not a sustainable option).

This is probably the most important slide. The assessment of senior leadership is terrible. Naturally, these results got less than a minute of discussion. On almost every dimension, the ratings are net negative (positive < negative) and, where there is historical data, it again shows profound drops over time. In many cases, AU’s executive is scoring at close to half of the sector average.
This is pretty clear evidence that staff see profound leadership failure. Only 29% agree that senior leaders inspire employees, and only 32% think senior leaders effectively establish priorities, do what they say they will do, and are adequately visible. This is a clear call for a housecleaning in the executive suite.
Only 30% think senior leadership will act on the issues identified in this survey. This was almost immediately shown to be true when, after the results were presented, the president, the VPA and the acting chief human resources officer all leaned hard on the message that the issue was a communications problem and the staff need to pull up our socks and work harder to help stem the bleeding of enrollments. While there was some lip service to the results as “sobering”and "removing barriers" to staff increasing discretionary effort, there was no real plan to address the problems or any sense that the executive was owning the results.
This is pretty consistent with AU’s past engagement surveys (2020 and 2019). The time between surveys was increased to two years to allow for a meaningful consideration and response by the executive. There was, predictably, none. And today’s presentation suggests AU’s executive are going to continue just try to “talk away” bad news instead of changing their behaviours.
That doesn’t sound like a very effective strategy to me. The staff reactions I've heard so far include anger at the victim blaming, disappointment at the vapid sloganeering, and regret for the hour of time we all wasted listening to the results.
-- Bob Barnetson
This is pretty clear evidence that staff see profound leadership failure. Only 29% agree that senior leaders inspire employees, and only 32% think senior leaders effectively establish priorities, do what they say they will do, and are adequately visible. This is a clear call for a housecleaning in the executive suite.
Only 30% think senior leadership will act on the issues identified in this survey. This was almost immediately shown to be true when, after the results were presented, the president, the VPA and the acting chief human resources officer all leaned hard on the message that the issue was a communications problem and the staff need to pull up our socks and work harder to help stem the bleeding of enrollments. While there was some lip service to the results as “sobering”and "removing barriers" to staff increasing discretionary effort, there was no real plan to address the problems or any sense that the executive was owning the results.
This is pretty consistent with AU’s past engagement surveys (2020 and 2019). The time between surveys was increased to two years to allow for a meaningful consideration and response by the executive. There was, predictably, none. And today’s presentation suggests AU’s executive are going to continue just try to “talk away” bad news instead of changing their behaviours.
That doesn’t sound like a very effective strategy to me. The staff reactions I've heard so far include anger at the victim blaming, disappointment at the vapid sloganeering, and regret for the hour of time we all wasted listening to the results.
-- Bob Barnetson
Monday, February 6, 2023
Research: Grievance Arbitration Project
Back in November, I posted a bit about a research project I’m involved with that is looking at grievance-arbitration decisions in Alberta. As of this morning, we’ve coded about 441 decisions by arbitrators (spanning 2006 to 2011) and I’m in a position to talk a bit more about the project and the themes we’re seeing.
When a union and an employer are unable to resolve a disagreement about how the employer has applied the collective agreement (or law, policy, or past practice), they can remit the dispute to an arbitrator for a decision. Arbitration is a form of adjudication akin to the courts. One of the main differences between arbitration and the courts is that, in arbitration, the two parties normally jointly select the arbitrator who will hear the matter (although, sometimes other appointment processes are used).
During the selection process, it is common for a side to internally discuss the merits of proposing or accepting particular arbitrators to hear a matter. This discussion appears premised on the assumption that arbitrators can be (un)sympathetic to certain arguments, evidence, types of grievances, and kinds of grievers. This belief is consistent with a constructivist view of the world, wherein there is infinite stimulus and what one pays attention to and how one interprets that stimulus is driven, in part, by one’s thoughts, beliefs, and expectations.
If the “who you get affects what you get” hypothesis is true, it suggests that identifying patterns in arbitrators’ decision-making can be used to increase the odds of success. This hypothesis (and, if true, the efficacy of various strategies that lever it) is part of what we’ll be examining once we’ve finished coding the dataset (ideally by Christmas 2023, but who knows).
In coding the dataset, we’re assigning the outcome of decisions one of three codes: union win, employer win, or mixed decision. An example of a mixed decision might be a termination grievance. The employer might seek to have the termination upheld, the union might seek to have it overturned and the worker reinstated without penalty, and the arbitrator may eventually decide there was grounds to discipline the worker, but that termination was unreasonable in the circumstances and then substitute some lesser penalty (e.g., a short suspension).
This coding allows us to visually (and statistically, I suppose) represent arbitral decisions like so. Yellow are union wins, green are mixed results, and blue are employer wins.
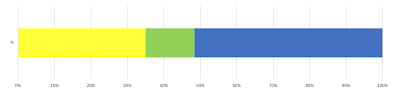
Note that, in this representation, both the union win and the mixed outcome category result in the worker being better off than they were before the decision. This suggests that looking at the “employer win” category (blue) is a useful way to get a quick and dirty sense of decision patterns.
The graphic above summarizes all decisions. The literature suggests that different types of disputes (e.g., discipline and termination grievances, salary and benefits grievances, grievances addressing seniority, selection, promotion and layoff) will have different win-loss patterns. I have teased apart the data that we have along these lines in the graphic below. Sorry the images are a bit har to read, the lines (top to bottom) are grievances addressing seniority, selection, promotion and layoff, salary and benefits grievances, discipline and termination grievances, and the overall average.
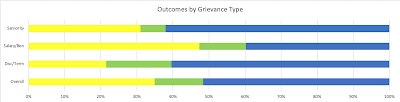
We do seem to see some interesting differences. Note that, in the discipline and termination decisions, the employer typically bears the onus (at least initially) or proving discipline was warranted. In most others kind of grievances, the union bears the onus of proving the grievance should be upheld.
If the “who you get affects what you gets” hypothesis is correct, we should see differences among the decision patterns of different arbitrators. I have presented below a randomly drawn selection of the early data in this regard (carefully anonymized) with the overall average at the top.
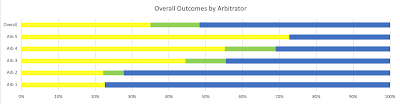
What this suggests is that there appear to be large differences in decision outcomes among arbitrators. Two important caveats are worth keeping in mind. This first is that the number of cases in the dataset to date for each arbitrator varies and is, overall, small. Small samples tend to yield swingy numbers, so we shouldn’t jump to conclusions based on a small sample. These differences may attenuate over time as we add cases (although we’re not seeing that yet in the data)
The second is that the facts of each case almost certainly impact the decision of the arbitrator. Our expectation is that, over many cases, differences between cases should attenuate (i.e., wash out) these case-specific differences. Together, these caveats also suggest that eliminating arbitrators with relatively few recorded decisions from the final dataset is likely appropriate.
When we look at arbitrator records on discipline and termination cases (which seem to be the largest single category of cases), we see similarly large differences among arbitrators. I have not visually presented that data, given the small number of cases for each arbitrator.
-- Bob Barnetson
When a union and an employer are unable to resolve a disagreement about how the employer has applied the collective agreement (or law, policy, or past practice), they can remit the dispute to an arbitrator for a decision. Arbitration is a form of adjudication akin to the courts. One of the main differences between arbitration and the courts is that, in arbitration, the two parties normally jointly select the arbitrator who will hear the matter (although, sometimes other appointment processes are used).
During the selection process, it is common for a side to internally discuss the merits of proposing or accepting particular arbitrators to hear a matter. This discussion appears premised on the assumption that arbitrators can be (un)sympathetic to certain arguments, evidence, types of grievances, and kinds of grievers. This belief is consistent with a constructivist view of the world, wherein there is infinite stimulus and what one pays attention to and how one interprets that stimulus is driven, in part, by one’s thoughts, beliefs, and expectations.
If the “who you get affects what you get” hypothesis is true, it suggests that identifying patterns in arbitrators’ decision-making can be used to increase the odds of success. This hypothesis (and, if true, the efficacy of various strategies that lever it) is part of what we’ll be examining once we’ve finished coding the dataset (ideally by Christmas 2023, but who knows).
In coding the dataset, we’re assigning the outcome of decisions one of three codes: union win, employer win, or mixed decision. An example of a mixed decision might be a termination grievance. The employer might seek to have the termination upheld, the union might seek to have it overturned and the worker reinstated without penalty, and the arbitrator may eventually decide there was grounds to discipline the worker, but that termination was unreasonable in the circumstances and then substitute some lesser penalty (e.g., a short suspension).
This coding allows us to visually (and statistically, I suppose) represent arbitral decisions like so. Yellow are union wins, green are mixed results, and blue are employer wins.

Note that, in this representation, both the union win and the mixed outcome category result in the worker being better off than they were before the decision. This suggests that looking at the “employer win” category (blue) is a useful way to get a quick and dirty sense of decision patterns.
The graphic above summarizes all decisions. The literature suggests that different types of disputes (e.g., discipline and termination grievances, salary and benefits grievances, grievances addressing seniority, selection, promotion and layoff) will have different win-loss patterns. I have teased apart the data that we have along these lines in the graphic below. Sorry the images are a bit har to read, the lines (top to bottom) are grievances addressing seniority, selection, promotion and layoff, salary and benefits grievances, discipline and termination grievances, and the overall average.

We do seem to see some interesting differences. Note that, in the discipline and termination decisions, the employer typically bears the onus (at least initially) or proving discipline was warranted. In most others kind of grievances, the union bears the onus of proving the grievance should be upheld.
If the “who you get affects what you gets” hypothesis is correct, we should see differences among the decision patterns of different arbitrators. I have presented below a randomly drawn selection of the early data in this regard (carefully anonymized) with the overall average at the top.

What this suggests is that there appear to be large differences in decision outcomes among arbitrators. Two important caveats are worth keeping in mind. This first is that the number of cases in the dataset to date for each arbitrator varies and is, overall, small. Small samples tend to yield swingy numbers, so we shouldn’t jump to conclusions based on a small sample. These differences may attenuate over time as we add cases (although we’re not seeing that yet in the data)
The second is that the facts of each case almost certainly impact the decision of the arbitrator. Our expectation is that, over many cases, differences between cases should attenuate (i.e., wash out) these case-specific differences. Together, these caveats also suggest that eliminating arbitrators with relatively few recorded decisions from the final dataset is likely appropriate.
When we look at arbitrator records on discipline and termination cases (which seem to be the largest single category of cases), we see similarly large differences among arbitrators. I have not visually presented that data, given the small number of cases for each arbitrator.
-- Bob Barnetson
Friday, September 9, 2022
Should I take a job at Athabasca University?

So, as the academic job-hunting season begins, I thought I’d take the opportunity to write down the pros and cons of taking a job at AU. These comments are mostly directed at folks considering a professorial job.
PROS
Working from home: Pre-pandemic, the vast majority of academic staff worked from home offices). Although the majority of staff live in Alberta, recently staff have been permitted to work anywhere in Canada. This means you can stay in your home community.
At the time of writing, the university’s Board is engaged in an ill-chosen bun fight with the provincial government over the ongoing loss of jobs in the town of Athabasca (where the university’s headquarters is located). The government wanted, at one point, 65% of staff to work from there (despite there being inadequate housing stocks and office space). It is unclear how this dispute is going to play out or how it will affect where academic staff can live. You’ll definitely want to ask about this in your interview.
Setting your own schedule: For the most part, instruction at AU is asynchronous and text mediated. Since you don’t have to appear at a fixed time each week to lecture, you can largely set your own schedule. Start early or late. Work in the middle of the night. Take your kids to school or you mom to the doctor. As long as you get your work done and show up for the small number of fixed meetings, you basically can organize your life however you want.
Good benefits and pension plans: The benefits plan for faculty is pretty good, particularly in terms of vision, eyecare, and drug coverage (although costs are reimbursed, not pre-paid).
The pension plan is also pretty good, although you’ll pay about 11% of your salary into the plan. You can collect a full pension when (1) you are at least 55, and (2) your age and years of services equal 80. A full pension is 70% of your average salary during your five best consecutive years of employment. You can take a reduced pension any time after 55 if you have not yet met the 80 factor.
Tenure and promotion is the norm: The vast majority of hires (>99%) can expect to get tenure and promotion. Based on my 18 years of experience, I’d go so far as to say you have to actively and repeatedly fuck-up not to get tenured. That is not to say you don’t have to work—just that the bar is set at a very manageable level.
Faculty are typically hired with a four-year probationary appointment. After a successful review, you receive tenure. You can choose when to apply for promotion in rank. If you apply for and receive promotion before your tenure review, then you also automatically get tenure. Promotion is also rarely denied although the process is more rigorous than just tenure.
Financial stability: AU is financially stable (despite a history of the administration crying insolvency). In 2021/22, AU posted a surplus of $10.4m on expenses of $150.6m. This was the sixth straight surplus and ninth surplus in 10 years. AU has an accrued surplus (i.e., cash in the bank) of $46.9m.
Government funding of AU has been stable over the past few years. Only about 35% of institutional revenue comes from grants (the largest chunk is tuition based). Enrollments have been falling (about 9% per year for last two years) but the nature of AU’s business model is that the costs of revenue losses due to declining enrollment are borne mostly by the tutor pool (i.e., permanent, part-time academics with variable teaching loads).
CONS
Poor wages: Overall, wages are low and have fallen significantly behind inflation. The table below compares the compounded cost-of-living adjustments (COLA) to faculty wages and Alberta inflation from 2013 to 2022. Basically, the purchasing power of staff wages at AU has dropped by ~20% over 10 years.

Going forward, the COLA for adjustment for 2023 will total between 2.75% and 3.25%. Unfortunately, inflation is presently running about 8%, so expect another big loss in purchasing power.
Compounding the erosion of purchasing power is that starting salaries in nominal dollars are roughly the same as they were in 2007. There is also evidence of a gender wage gap (but zero interest by the institution in addressing it). While the institution will often say that salaries are negotiable, in practice that is not the case.
Poor Treatment and Low Morale: The treatment of staff by the university is, in a word, awful. I’ve been on the union grievance committee for a decade. While I can’t tell you everything I’ve seen, here are a few illustrative examples of how individual staff have been treated:
- AU knew it disciplined staff member improperly but took no action to fix.
- AU accused a staff member of faking sick leave while his spouse was dying of cancer
- AU forced a staff member to delay maternity leave or lose their sabbatical.
- AU terminated nurses’ market supplements during a pandemic with no notice and then denied they were doing so.
- AU dissolved a promotion committee with no cause
- AU re-opened its campuses with no effective COVID protocols in place
The most recent survey of staff (Spring 2022) by the faculty association finds only 20% of staff trust the senior executive and only 39% agree with the statement that “my morale is high.” The employer no longer does staff surveys because the results were so consistently bad.
Workloads have also gone up, particularly for administrative staff, due to COVID. More subjectively, I’m seeing a widespread withdrawal of citizenship behaviours and effort by my colleagues. Essentially, they are realizing AU doesn’t care for them and are (understandably) reciprocating in kind. The upside is the union is tenacious, fights hard, and has strong member support.
Isolation: Working from home with essentially no in-person contact with co-workers or students is extremely isolating and may not be for everyone. Further, AU has no functional orientation process for new staff and most of the institution’s processes do not operate in the way that the various policies and procedures (often decades old) say that they do.
COVID has limited the opportunity for staff to meet socially (which is how we used to cope with the isolation and get our questions answered). In theory, more experienced colleagues in your area should provide you with an orientation and social introductions. In practice, the experiences of new hires is very uneven.
So, with those thoughts and the poor state of the academic job market in mind, one approach to a job offer might be:
- if you have no other option, take the AU job but stay on the market, and
- if you have other options, give the pros and cons of AU very careful thought.
Tuesday, August 2, 2022
Alberta Labour's 2021/22 Annual Report
At the end of June, the government of Alberta dropped the annual reports for all ministries for the year ending March 31, 2022. The Labour report provides a snap-shot of government enforcement of labour laws as well as a hint at some of the outcomes. What the report addresses (and what it omits) is interesting.
For example, last year, the annual report noted that the government was sitting on a report of the minimum wage commission (struck in 2019, reporting in early 2020), The expectation was that this report recommended expanding the existing two-tiered minimum wage and that the government would use this as a pretext for reimplementing a lower wage for some servers.
That report was never released (as far as I can tell). This year, there is literally no mention of the minimum wage. Perhaps the government has given up on the idea given the struggle faced by employers to recruit servers? This, in turn, suggests that the existing minimum wage (stagnant since 2018) may be inadequate.
Or maybe, with three Labour ministers in a year, each worse than the last, the department just lost track of this issue? Anyhow, let's have a look at the various regulatory areas the government reports on.
Employment Standards
Employment standards set out the minimum terms and conditions of work. If your employer screws you, you can file a complaint. Over time, complaint numbers have dropped significantly.

There is, once again, no concrete explanation for this drop. Many things can affect complaint volume, including the number of workers and their expectation that complaining will be beneficial (e.g., result in a net gain, not result in retaliation). A 41.9% reduction in complaints since 2016/17 is pretty significant, especially since employment numbers rebounded during 2021/22.
Overall inquiries by Albertans about Employment Standards are also down. There were 131,189 phone and email inquiries in 2019/20 and only 70,826 in 20221/22 (a 46.0% reduction). Again, no compelling explanation for this change is offered. One possibility is that Alberta workers are decreasingly seeing Employment Standards as a viable way to enforce their rights. The drop since the UCP came to power is particularly striking.
There was an increase in Employment Standards enforcement this year. Instead of one administrative penalty, Alberta issued three penalties, the largest being $1500. The lack of consequences for noncompliance (beyond maybe having to pay some or all of what an employer should have paid in the first place) not only makes Alberta’s Employment Standards laws pretty toothless, but, in fact, economically incentivizes employers to cheat workers because they will likely get away with it.
Occupational Health and Safety
Alberta’s OHS system is designed to reduce workplace injuries and fatalities by educating employers and workers about safe work practices, conducting inspections to ensure compliance, and issuing orders and penalties when employers fail to operate safely.

The bump in inspections in 2020/21 was due almost entirely to additional COVID-related inspections and numbers seem to have returned to historical numbers. Almost 12,000 inspections seems like a lot of inspections, but we need to consider the context.
There were about 155,000 employers registered with the WCB. That undercounts total employers but whatever—this is back of napkin work. If we use 155,000 as a rough proxy for total employers and there were 11,798 inspections, we’re (roughly speaking), looking at a workplace being inspected once every 13 years.
If you did something more fine-grained (e.g., bigger employer pool; controlled for employers getting inspected more than once in a year), that telescopes the inspection cycle out some (maybe once per 15 years, maybe longer). The point, though, is that most worksites will effectively never get inspected.
If workplaces do get inspected, what happens? Mostly likely, if there are violations found, employers just get ordered to remedy them. But the number of compliance orders has dropped by about half since 2018/19 (the last full year of the ND government).
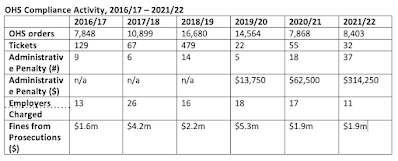
OHS almost never uses the enforcement tools available to it. OHS tickets dropped from 479 tickets in 2018/19 (again, the last year of the NDP government) to 32 this past year (a 93.4% drop). Of the 32 tickets issued in 2021/22, nine went to employers while the rest went to supervisors or workers. The largest ticket to an employer was $575 while the largest ticket to a worker was $230. These values have not changed in recent memory
Interestingly, the number and value of administrative penalties went up significantly this year, especially in dollar value. I don’t know what explains this. Only 11 charges were laid under the OHS Act, compared to 17 the previous year. Fines from prosecutions remained steady at $1.9m, with $1.2m being paid in the form of creative sentences (e.g., donations to community groups).
Effectiveness of Injury Prevention
So is this approach to injury prevention effective? One way to measure prevention effectiveness is to look at injury outcomes (particularly injury rates per 100 person-years worked) over time. Using a rate controls for fluctuations in the population over time and allow us to see patterns.
Alberta uses two main injury rates: lost-time claims and disabling injuries.

The government notes that COVID played a significant role in rising disabling injury rates, If COVID-related claims are excluded, the DI rate would be 2.32 in 2020/21 and 2.46 in 2021/22.
Labour Relations
The Alberta Labour Relations Board (ALRB) administers and adjudicates applications and complaints about labour relations. The most interesting datapoint in the annual report is the number of certification applications (i.e., when a union applies to represent a group of workers).
In 2017, the ND government made it easier for workers to unionize by allowing card-check certification. Like every other jurisdiction where this change has been implemented, unionizing efforts increased significantly (because employers are deprived of the opportunity to meddle in the workers’ choice). In 2019, the UCP removed card check and, not surprisingly, certification dropped significantly. There are some confounding factors here (lag effects, COVID in 2020 and rising interest in unions in 2021) that we can’t control for, but that pattern is plain enough.

There are also a couple of interesting things tucked away in the details. There has been a dramatic increase in the number of days it takes for an application to get to hearing. This matters because delay usually benefits one side (almost always the employer).

The Board also continues to lag in rendering a decision in a timely manner. Again, delay tends to benefit employers.

This is partly explained as a function of writing time lost to additional administrative demands related to virtual hearings.
Conclusion
Overall, the administrative performance of Alberta’s labour law regime has declined over time, particularly since the UCP took office. Particularly worrying is the increase in injuries and the decline in certification applications. The underlying issue likely reflects policy directions and/or funding reductions enacted by the UCP.
-- Bob Barnetson
For example, last year, the annual report noted that the government was sitting on a report of the minimum wage commission (struck in 2019, reporting in early 2020), The expectation was that this report recommended expanding the existing two-tiered minimum wage and that the government would use this as a pretext for reimplementing a lower wage for some servers.
That report was never released (as far as I can tell). This year, there is literally no mention of the minimum wage. Perhaps the government has given up on the idea given the struggle faced by employers to recruit servers? This, in turn, suggests that the existing minimum wage (stagnant since 2018) may be inadequate.
Or maybe, with three Labour ministers in a year, each worse than the last, the department just lost track of this issue? Anyhow, let's have a look at the various regulatory areas the government reports on.
Employment Standards
Employment standards set out the minimum terms and conditions of work. If your employer screws you, you can file a complaint. Over time, complaint numbers have dropped significantly.

There is, once again, no concrete explanation for this drop. Many things can affect complaint volume, including the number of workers and their expectation that complaining will be beneficial (e.g., result in a net gain, not result in retaliation). A 41.9% reduction in complaints since 2016/17 is pretty significant, especially since employment numbers rebounded during 2021/22.
Overall inquiries by Albertans about Employment Standards are also down. There were 131,189 phone and email inquiries in 2019/20 and only 70,826 in 20221/22 (a 46.0% reduction). Again, no compelling explanation for this change is offered. One possibility is that Alberta workers are decreasingly seeing Employment Standards as a viable way to enforce their rights. The drop since the UCP came to power is particularly striking.
There was an increase in Employment Standards enforcement this year. Instead of one administrative penalty, Alberta issued three penalties, the largest being $1500. The lack of consequences for noncompliance (beyond maybe having to pay some or all of what an employer should have paid in the first place) not only makes Alberta’s Employment Standards laws pretty toothless, but, in fact, economically incentivizes employers to cheat workers because they will likely get away with it.
Occupational Health and Safety
Alberta’s OHS system is designed to reduce workplace injuries and fatalities by educating employers and workers about safe work practices, conducting inspections to ensure compliance, and issuing orders and penalties when employers fail to operate safely.

The bump in inspections in 2020/21 was due almost entirely to additional COVID-related inspections and numbers seem to have returned to historical numbers. Almost 12,000 inspections seems like a lot of inspections, but we need to consider the context.
There were about 155,000 employers registered with the WCB. That undercounts total employers but whatever—this is back of napkin work. If we use 155,000 as a rough proxy for total employers and there were 11,798 inspections, we’re (roughly speaking), looking at a workplace being inspected once every 13 years.
If you did something more fine-grained (e.g., bigger employer pool; controlled for employers getting inspected more than once in a year), that telescopes the inspection cycle out some (maybe once per 15 years, maybe longer). The point, though, is that most worksites will effectively never get inspected.
If workplaces do get inspected, what happens? Mostly likely, if there are violations found, employers just get ordered to remedy them. But the number of compliance orders has dropped by about half since 2018/19 (the last full year of the ND government).

OHS almost never uses the enforcement tools available to it. OHS tickets dropped from 479 tickets in 2018/19 (again, the last year of the NDP government) to 32 this past year (a 93.4% drop). Of the 32 tickets issued in 2021/22, nine went to employers while the rest went to supervisors or workers. The largest ticket to an employer was $575 while the largest ticket to a worker was $230. These values have not changed in recent memory
Interestingly, the number and value of administrative penalties went up significantly this year, especially in dollar value. I don’t know what explains this. Only 11 charges were laid under the OHS Act, compared to 17 the previous year. Fines from prosecutions remained steady at $1.9m, with $1.2m being paid in the form of creative sentences (e.g., donations to community groups).
Effectiveness of Injury Prevention
So is this approach to injury prevention effective? One way to measure prevention effectiveness is to look at injury outcomes (particularly injury rates per 100 person-years worked) over time. Using a rate controls for fluctuations in the population over time and allow us to see patterns.
Alberta uses two main injury rates: lost-time claims and disabling injuries.
- Lost-time claims are accepted are injuries that required time off work beyond the date of injury. These are usually the most serious kinds of injuries.
- Disabling injuries are accepted injury claims that required time off or modified work duties.

The government notes that COVID played a significant role in rising disabling injury rates, If COVID-related claims are excluded, the DI rate would be 2.32 in 2020/21 and 2.46 in 2021/22.
Labour Relations
The Alberta Labour Relations Board (ALRB) administers and adjudicates applications and complaints about labour relations. The most interesting datapoint in the annual report is the number of certification applications (i.e., when a union applies to represent a group of workers).
In 2017, the ND government made it easier for workers to unionize by allowing card-check certification. Like every other jurisdiction where this change has been implemented, unionizing efforts increased significantly (because employers are deprived of the opportunity to meddle in the workers’ choice). In 2019, the UCP removed card check and, not surprisingly, certification dropped significantly. There are some confounding factors here (lag effects, COVID in 2020 and rising interest in unions in 2021) that we can’t control for, but that pattern is plain enough.

There are also a couple of interesting things tucked away in the details. There has been a dramatic increase in the number of days it takes for an application to get to hearing. This matters because delay usually benefits one side (almost always the employer).

The Board also continues to lag in rendering a decision in a timely manner. Again, delay tends to benefit employers.

This is partly explained as a function of writing time lost to additional administrative demands related to virtual hearings.
Conclusion
Overall, the administrative performance of Alberta’s labour law regime has declined over time, particularly since the UCP took office. Particularly worrying is the increase in injuries and the decline in certification applications. The underlying issue likely reflects policy directions and/or funding reductions enacted by the UCP.
Monday, May 9, 2022
2020 national work-related fatality and injury stats
Sean Tucker and Anya Keefe from the University of Regina have released their annual report on workplace fatalities and injuries. This year’s report rolls up the 2020 data but also includes a section on COVID-related injuries and fatalities from 2020 and 2021.
The nub of the report is that, nationally in 2020:
Alberta had the second highest number of COVID-related fatality claims accepted (31) in 2021.
-- Bob Barnetson
The nub of the report is that, nationally in 2020:
- There were 924 accepted WCB claims for fatalities, with about two-thirds being caused by occupationally-related diseases.
- There were also 254,000 accepted claims for lost-time injuries.
- Among provinces, Alberta had the second highest five-year average injury fatality rate, although there was a slight decline noted in 2020’s injury fatality rate.
- Among provinces, Alberta had the third highest five-year average disease fatality rate, although there was an increase noted in 2020’s disease fatality rate.
- Among provinces, Alberta had one of the lowest five-year average lost-time claim rates, although there was a slight increase noted in 2020’s lost-time claim rate.


- Alberta had the third highest level of COVID-related injury claims accepted (7846) on 2021. There were 4800 accepted in 2020.
-- Bob Barnetson
Tuesday, February 1, 2022
Unions positively impact US workers' wages, benefits, democracy
There is an interesting new study out the US that documents the impact of unions on workers lives. Among its findings are:
On average, the 17 U.S. states with the highest union densities have:
On average, the 17 U.S. states with the highest union densities have:
- higher than average minimum wages, and minimum wage sup to 40% higher than those in low-union-density states
- higher median annual incomes
- more unemployed workers eligible to receive unemployment insurance benefits
- fewer workers without health insurance
- a greater likelihood of legislated paid sick leave laws and paid family and medical leave laws
- fewer restrictive voting laws.
You can read the full study at the link above.
-- Bob Barnetson
Tuesday, November 23, 2021
AUPE survey on pandemic needs
The Alberta Union of Provincial Employees (AUPE) periodically publishes a magazine (Direct Impact). The fall 2021 issue (not yet online at the time of writing) reports the results of a survey of its members about the impact of COVID.
The survey is fascinating, documenting income losses by two-thirds of members, with the losses being highly racialized. More than a quarter of member households experienced a layoff and almost half (49%) cut back on food purchases. An interesting question was what measures would help AUPE members cope with the financial hardships caused by COVID. I've nicked the graphic (sorry Guy!) and present it below:

Keep in mind that these results represent the view of unionized workers in AUPE who responded to the survey (I don't see a note about response rates). This means we should be cautious about its findings and especially of generalizing to other populations.
The pearl-clutching aside, what is most striking is that workers overwhelming identify price controls as what would help them most. Many of the COVID demands popularized by the broader labour movement (e.g., paid sick leave, presumptive WCB, childcare subsidies) received much less support.
Further, demanding government intervention in the market (which neoliberalism suggests is anathema, unless it benefits the wealthy) is a surprisingly bold position for such a large portion of the respondents to stake out. Perhaps the pressure COVID is create and how it has pulled back the curtain on class-disparities is starting to more clearly inform rank-and-file views on union priorities?
-- Bob Barnetson
Monday, August 9, 2021
Alberta Labour 2020/21 Annual Report
Alberta Labour released its annual report for 2020/21. As usual, there are a number of interesting tidbits to be found in amongst the spin doctoring. For example, the report (p.18) identifies that the Minimum Wage panel (struck in 2019) to examine the impact of minimum wage changes (and likely to support reducing the minimum wage for servers) reported (I’m told in the spring of 2020) and the government is sitting in the report.
Given the difficulty that many minimum-wage employers are having recruiting staff, it will be interesting to see if the government goes ahead with re-introducing this two-tier wage structure and, if it does, whether employees will be able to take advantage of it and grind server wages.
There was some interesting analysis this year that higher youth wages do not appear associated with job losses among youth (which was the pretext for introduce a lower youth wage in 2019). There is also some suggestion that lower youth wages have not resulted in improvements in youth unemployment. In June, youth (age 15-24) unemployment was 18.1% in Alberta, basically double overall unemployment (9.3%).
The emphasis on helping unemployed Albertans return to work (either via additional training or labour market services) is notable and reflects the 6.6% drop in employment in 2020. The government also reduced by about a third the number of spots available to migrant workers who wish to become permanent citizens to, in part, “enable more job opportunities for unemployed Albertans” (p. 36). Interestingly, the department continued to make efforts to increase labour mobility within Canada by lowering the already low barriers to having certifications from other provinces recognized (pp.37,39).
Employment Standards

The number of Employment Standards complaints dropped by about 35% between 2018/19 and 20201/21. This likely triggered drops in other ES metrics (some of which are positive). There is no analysis of why complaints dropped or which kinds of complaints declined. Potential explanations include fewer Albertans working and fewer Albertans willing to complain given the high level of unemployment.
There is no data provided on what percentage of complaints were found to be valid or how much unpaid wages were recovered (or not recovered). The number of human trafficking investigations jumped from 59 to 95 (no data on outcomes) and single administrative penalty was issues to an employer who derived economic benefits from non-compliance. The report pumps this up as the biggest fine ever issues. What is ignored is that pretty much all valid ES complaints involve the employer enjoying an economic benefit. So a single employer being penalized is not really a huge success.
Occupational Health and Safety

The number of OHS inspections was way up last year, likely reflecting the demands of COVID. The number of orders written was, however, way down. The explanation offered is a bit hard to parse but I think it says that basically OHS only lowered the boom when there was repeated noncompliance. What this tells employers is that they basically get a free pass on their first offence (unless someone gets injured or killed), which does not really incentivize voluntary, pro-active compliance by employers.
There were 55 tickets issues in 2020/21 (mostly to workers). Once again, the report omits important context which is that, under the UCP, ticketing has dropped off to essentially nothing. In 2018/19, there were 479 tickets issues. This dropped to 22 tickets in 2019/20 and remains low in 2020/21.
There were also 18 administrative penalties issued to employers, totalling $62,500. This number is up over last year (14) but I can’t find the data to track the dollar value. Seventeen charges were laid this year against employers (about the same as last year). Fines as a result of convictions dropped from $5.2m to $1.9m because, you guessed it, the number of charges in previous years dropped.
Injury Stats

While injury rates an not very good measures of injury due to massive under-reporting, they do offer year-over-year a measure. There was a significant jump (8%) in lost-time claims and is at the highest level since 2011. COVID explains part of the jump this year, but it is notable that there has been a long-term trend (since 2016) upwards. This suggests that Alberta injury prevention efforts are not working. Accepted fatalities sat at 130, which is about the same as last two years.
Labour Relations

The number of certification applications in 2020/21 was way down (51%). This is likely the result of the reintroduction of mandatory votes (which makes certification drives riskier for unions) and COVID. On the upside, the Labor Board finally began allowing electronic filing (dumping their outdated paper/fax-only system).
-- Bob Barnetson
Given the difficulty that many minimum-wage employers are having recruiting staff, it will be interesting to see if the government goes ahead with re-introducing this two-tier wage structure and, if it does, whether employees will be able to take advantage of it and grind server wages.
There was some interesting analysis this year that higher youth wages do not appear associated with job losses among youth (which was the pretext for introduce a lower youth wage in 2019). There is also some suggestion that lower youth wages have not resulted in improvements in youth unemployment. In June, youth (age 15-24) unemployment was 18.1% in Alberta, basically double overall unemployment (9.3%).
The emphasis on helping unemployed Albertans return to work (either via additional training or labour market services) is notable and reflects the 6.6% drop in employment in 2020. The government also reduced by about a third the number of spots available to migrant workers who wish to become permanent citizens to, in part, “enable more job opportunities for unemployed Albertans” (p. 36). Interestingly, the department continued to make efforts to increase labour mobility within Canada by lowering the already low barriers to having certifications from other provinces recognized (pp.37,39).
Employment Standards

The number of Employment Standards complaints dropped by about 35% between 2018/19 and 20201/21. This likely triggered drops in other ES metrics (some of which are positive). There is no analysis of why complaints dropped or which kinds of complaints declined. Potential explanations include fewer Albertans working and fewer Albertans willing to complain given the high level of unemployment.
There is no data provided on what percentage of complaints were found to be valid or how much unpaid wages were recovered (or not recovered). The number of human trafficking investigations jumped from 59 to 95 (no data on outcomes) and single administrative penalty was issues to an employer who derived economic benefits from non-compliance. The report pumps this up as the biggest fine ever issues. What is ignored is that pretty much all valid ES complaints involve the employer enjoying an economic benefit. So a single employer being penalized is not really a huge success.
Occupational Health and Safety

The number of OHS inspections was way up last year, likely reflecting the demands of COVID. The number of orders written was, however, way down. The explanation offered is a bit hard to parse but I think it says that basically OHS only lowered the boom when there was repeated noncompliance. What this tells employers is that they basically get a free pass on their first offence (unless someone gets injured or killed), which does not really incentivize voluntary, pro-active compliance by employers.
There were 55 tickets issues in 2020/21 (mostly to workers). Once again, the report omits important context which is that, under the UCP, ticketing has dropped off to essentially nothing. In 2018/19, there were 479 tickets issues. This dropped to 22 tickets in 2019/20 and remains low in 2020/21.
There were also 18 administrative penalties issued to employers, totalling $62,500. This number is up over last year (14) but I can’t find the data to track the dollar value. Seventeen charges were laid this year against employers (about the same as last year). Fines as a result of convictions dropped from $5.2m to $1.9m because, you guessed it, the number of charges in previous years dropped.
Injury Stats

While injury rates an not very good measures of injury due to massive under-reporting, they do offer year-over-year a measure. There was a significant jump (8%) in lost-time claims and is at the highest level since 2011. COVID explains part of the jump this year, but it is notable that there has been a long-term trend (since 2016) upwards. This suggests that Alberta injury prevention efforts are not working. Accepted fatalities sat at 130, which is about the same as last two years.
Labour Relations
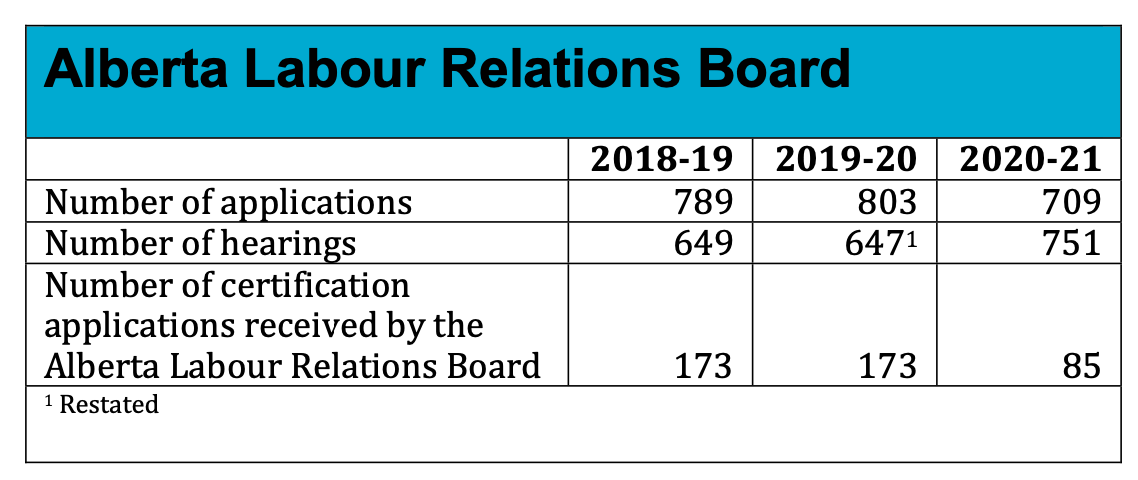
The number of certification applications in 2020/21 was way down (51%). This is likely the result of the reintroduction of mandatory votes (which makes certification drives riskier for unions) and COVID. On the upside, the Labor Board finally began allowing electronic filing (dumping their outdated paper/fax-only system).
-- Bob Barnetson
Subscribe to:
Posts (Atom)